


MyRadar
News
—
A True Model Mishap: Last Tuesday’s Unpredictable Snowstorm
by Will Cano | News Contributor
2/13/2024
ITHACA, NY — Sunday morning rose with a crisp chill and cloudy skies. It felt like prime conditions for snowfall, and upon looking at the forecast, my eyes widened. A Winter Storm Watch had been issued for 7+ inches of snow, with snowfall rates of 2-3 inches per hour possible. The storm would hit Tuesday morning.
The storm's setup involved two pieces of energy converging over the northeast — a notoriously tricky forecast. The models had recently taken a northward trend, with places like Binghamton, Albany, and Boston in the bullseye. With only a day-and-a-half left until the storm, a consensus surely had been reached.
What happened on Tuesday morning was much different.
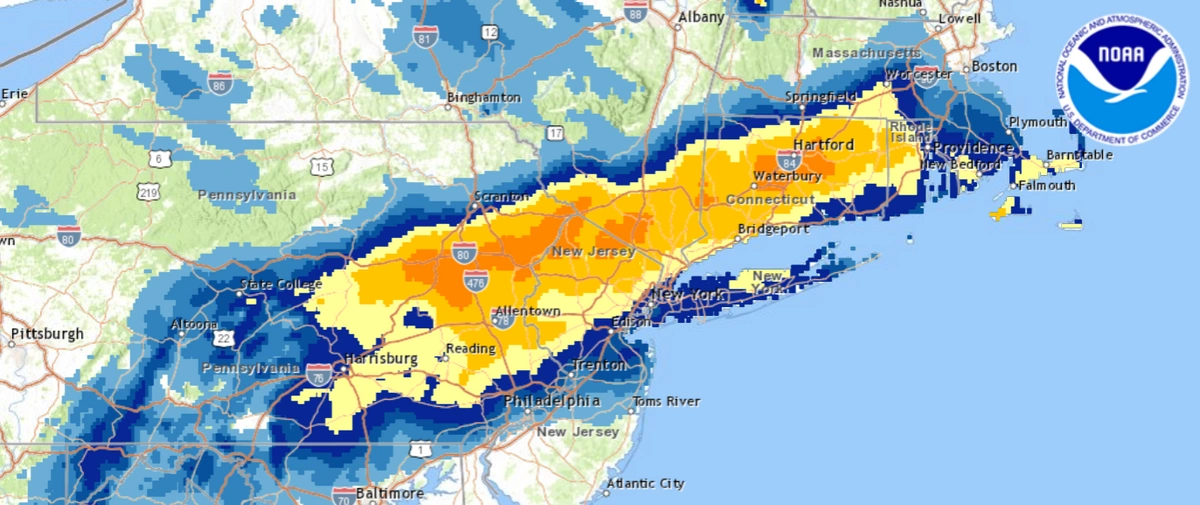
The snow jackpot had shifted over 100 miles to the south and east. New York City had it's greatest snowfall in two years, Long Island recorded up to ten inches of snow, and the Philadelphia suburbs received half a foot.
Binghamton and Albany were caught without a flake, and Boston received 0.1 inches.
This massive shift is one of the most significant in recent memory for meteorologists. So what caused this model failure?

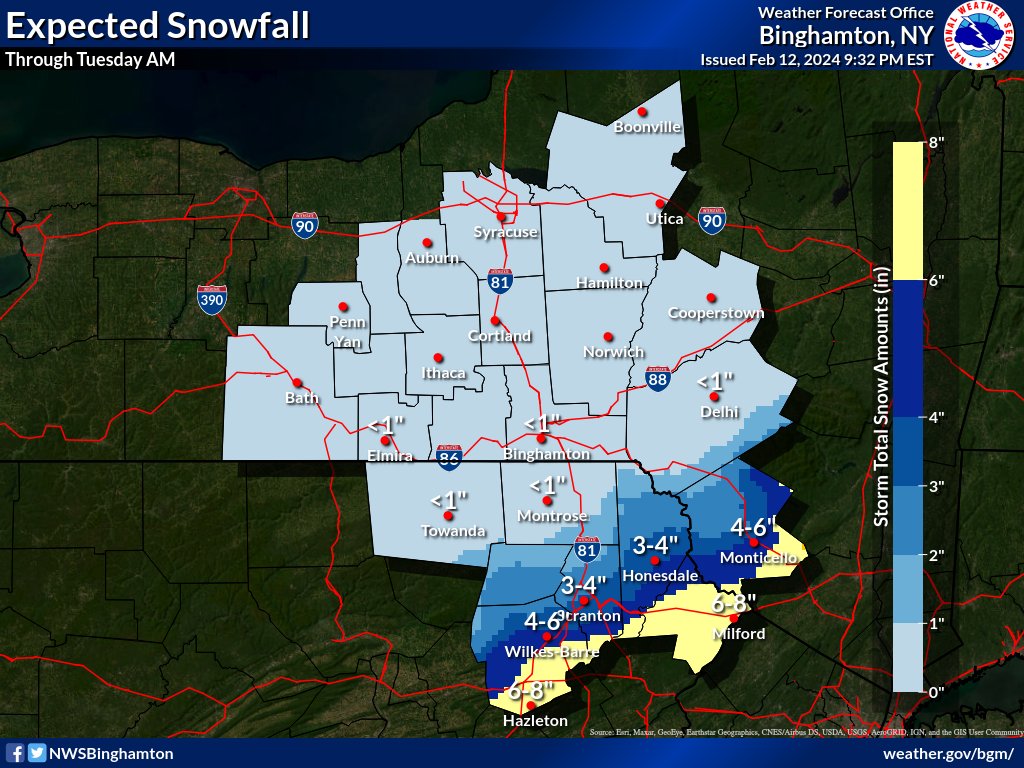
Two official forecasts from NWS Binghamton for the two days leading up to the storm, showing the substantial SE shift across the Southern Tier. NWS Binghamton
"It's not the first time we've seen a shift in snowfall so late in the forecast" says Theodore Champney, a meteorologist for the National Weather Service in Binghamton. When Binghamton received a walloping 40 inches of snow from a snowstorm in 2021, only half of that was forecasted.
"The heaviest band of snow was forecasted to set up and persist over Scranton. It switched to the Southern Tier at the last second" recalls Champney.
But there's a substantial difference between where the heaviest snow falls and where no snow falls, especially when that line changes by a hundred miles.
The snowfall forecast across Massachusetts over the three days prior to the storm. Notice the sharp cutoff to the north, especially in the final 24 hours. NWS Boston/Norton
What made this storm so unique is the many different factors that affected the storm's strength.
In order for a big snowstorm to strike the interior Northeast, a prominent trough needs to persist over the east coast. This bends the jet stream to the eastern seaboard, and storms follow it like a train on railroad tracks.
This means lower than normal 500 millibar height anomalies across the East coast. The lower the heights, the stronger the storm can become.
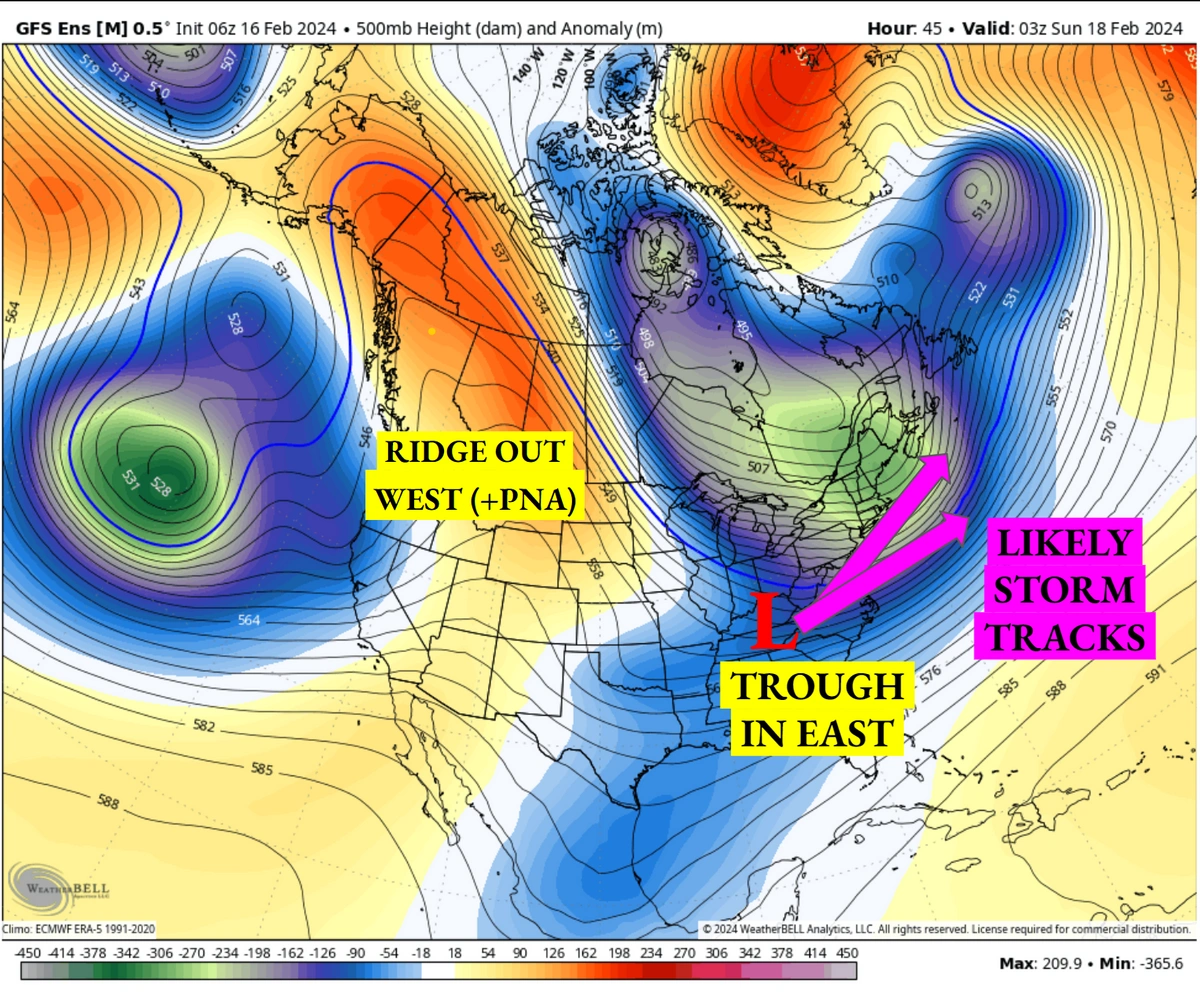
A favorable 500mb pattern for snow in the Northeast. The strength of the trough in the east will greatly affect the storm track. WeatherBell
Falsely predicting these heights was a major error all models made. The storm had a much more progressive evolution, sliding off the coast to the East rather than riding it to the North. In other words, the heights were not as low as forecasted, resulting in a weaker and further-south storm.
On Tuesday Morning, the Philadelphia suburbs were predicted to receive a slushy 1-2 inches of snow after a night full of rain. On Tuesday morning, classes were cancelled at all school districts, a Winter Storm Warning had been issued, and 4-8 inches of snow fell.
What caused this model miscalculation remains a mystery, but two culprits stick out.
The first involves the strength of the upper-level shortwave, or the piece of energy that was a driver of the surface low pressure system.
"Two to four days before the storm, the northern shortwave appeared to be fairly amped" explains Robert Deal, the Science and Operations Officer at NWS Mt. Holly. "As the onset of the storm got closer, the models showed the north-stream shortwave much weaker and de-amped. This shunted the snow axis to the southeast."
A weaker piece of energy aloft means that there is less divergence aloft. This in turn creates a weaker system at the surface and a sharp snowfall gradient to the northwest.
Cyclonic Vorticity at the 500mb level, which represents pieces of energy. The northern piece of energy over Michigan becomes flatter and further east — a trend that models did not solidify until hours before the storm. Tropical Tidbits
Deal also notes the difficulty of this forecast in regions that did get the most snow. "A narrow band of heavy snow set up through southeast PA, northern New Jersey, and Connecticut that was able to overcome marginal temperatures. Predicting where this would happen was something we were still forecasting during the event."
A second culprit relates to how the storm first performed in the south. As the low pressure moved across the Tennessee Valley, it pulled moisture from the Gulf of Mexico. An elevated severe weather risk formed across the south. The National Weather Service explained in a area forecast discussion how the severity of these storms could change affect the path of the snowstorm in the northeast:
'There is the possibility of a continued slight NW trend with this storm with deep convention likely in the warm sector with latent heat release potentially helping build the upstream ridge further leading to more amplification of the pattern.'
This jargon boils down to some pretty basic physics. If the storms in the southeast are robust, they require a lot of energy and release a lot of heat. This heat tends to travel ahead of the storm at an altitude that affects 500mb heights. Warmer temperatures aloft force a stronger ridge to build over the Atlantic, leading to a steeper storm track and amplification.
While thunderstorms did occur across the southeast on Monday, they underperformed in terms of severity. Not enough heat was released to build the ridge, leading to a flatter and weaker storm.
While we have attention on the dramatic forecast shifts in the Northeast US for tomorrow, this is a good time to bring attention to this:
— Tomer Burg (@burgwx) February 12, 2024
There's a prevailing rule of thumb that storms mostly, or always, trend more amplified/NW with decreasing lead time. This storm defied that! pic.twitter.com/HdEuoI7jWM
At weather offices across the northeast, 'model evaluation' teams are in place to further investigate where the models went wrong.
Evaluations like this will someday be replaced by machine-learning models, which adjust future forecast based on biases and mistakes they made for previous storms. Storms like this are why this cutting-edge technology is being researched so extensively.
This volatile forecast reminds us to always check the forecast, no matter the certainty.